The blog of a dedicated radio amateur and electronics enthusiast

"Having fun on the air and in the workshop - communicating and creating"

20 January 2023

CCS811 VOC & CO2 Gas Sensor

Until just recently I was using analogue gas sensors, ( see previous post 16 January ). I have now turned my attention to digital gas sensors, from which the measurement data are already in digital form.
I am experimenting with the CCS811 sensor which has a I2C digital interface, ( 2-wire bus, clock and data only ). The CCS811 measures the concentration of CO2 ( carbon dioxide ) and TVOC ( total volatile organic compounds, which become a gas at room temperature ) in the air in ppm and ppb respectively which would be useful in giving an indication of air-quality in a closed workshop environment.
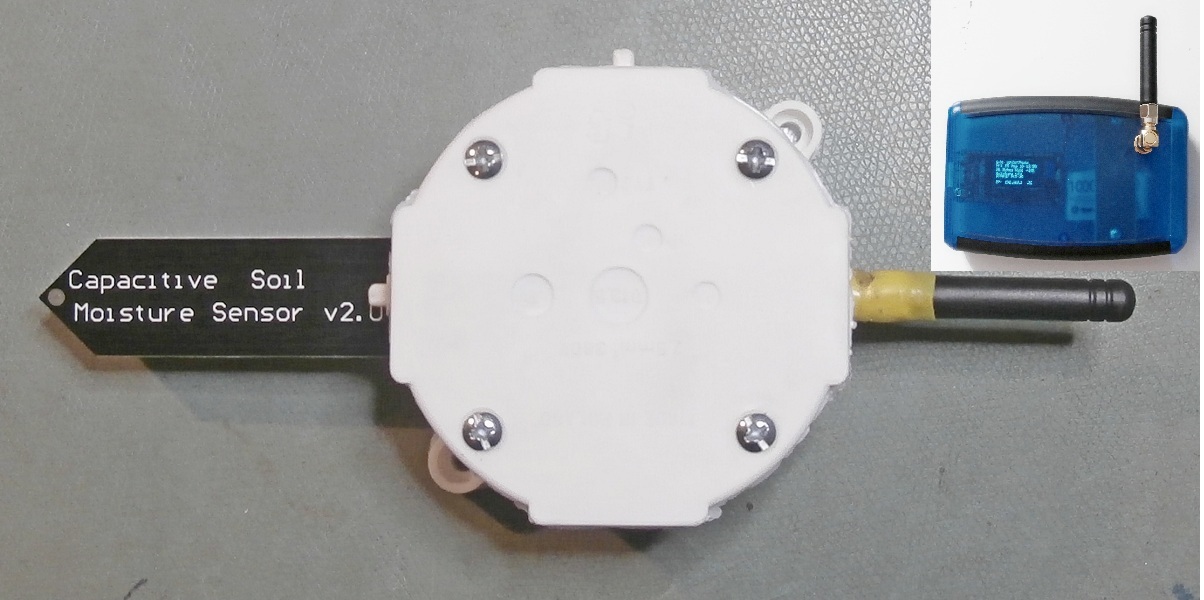
I connected an ESP32 micro-controller development board to the CCS811 circuit board and also to a I2C 128x64px blue OLED display in the corner of an already densely populated solderless breadboard.
( top-left) Mauve coloured CCS811 circuit board
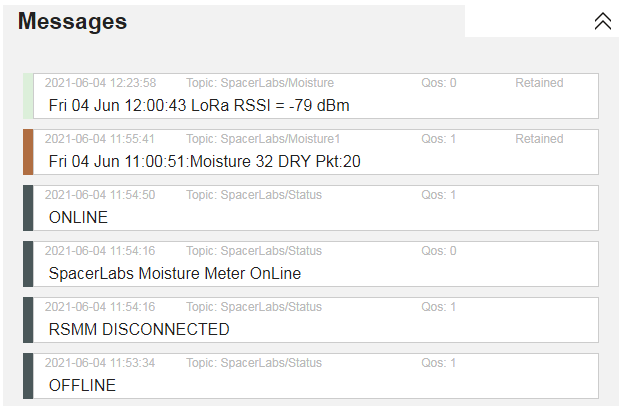
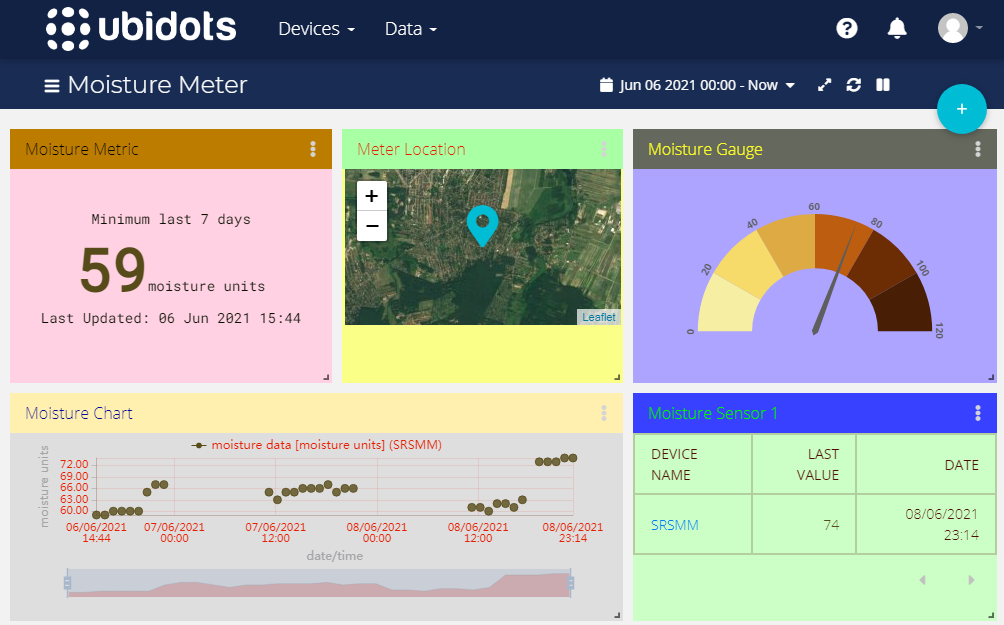
The measurement results being displayed were obtained in my basement workshop. There is an established air-quality index called the 'TVOC Index' which is derived from the TVOC ppb concentration. Ppb between 0 & 220 corresponds to a TVOC Index of between 0 & 50 and an 'Index Category' of 'Good' air quality. I am pleased as I spend a lot of time in the basement.
 
I2C = Inter Integrated Circuit
ppm/ppb = parts per million/billion
  

16 January 2023

Multi Gas Detector

The 'MQ-' series of gas sensors comprises many different types, and each one is sensitive to one or more specific gases. They are analogue sensors meaning that a voltage is produced that varies with gas concentration. They are also cheap. I bought several MQ-135 and MQ-4 types for use in simple multi gas detectors.
The varying output voltage from the sensor was connected to a 12bit analogue to digital converter on an ESP32 micro-controller development board and the various gas concentrations in the air in the workshop were displayed in parts per million ( ppm ) on a 320x240px colour display.
The MQ-135 sensor is sensitive to the following gases: carbon dioxide, alcohol, carbon monoxide, toluene, ammonia & acetone.
The MQ-135 sensor is near the bottom-left corner
The MQ-4 sensor was used in another multi-gas detector to detect LPG, methane, carbon monoxide, alcohol & smoke.
LPG = Liquefied Petroleum Gas
 

06 January 2023

Touch Screen Displays

Nowadays it seems almost obligatory that electronic gadgets have a touch screen display user-interface.
The particular display type I have been trying out recently is a 2.8" 240x320 pixel TFT LCD touch panel display with SPI and using the ILI9341 driver chip. On the back is an SD card slot. Cost when purchased was just under GBP11.
The display and an ESP32 micro-controller development board, ( with my code uploaded to it ), were mounted on a prototyping board and connected up. The ESP32 micro-controller has two built-in sensors; a temperature sensor which measures the CPU temperature, and a Hall-Effect sensor which responds to magnetic fields. Either cpu temperature or magnetic field data can be displayed separately in real-time by tapping on a displayed 'button', which is then highlighted in green.
The CPU temperature measurement has been selected
Although both measurement values could easily have been displayed together, I now have my ready made code to import into future projects which really would benefit from a touch screen.
( SPI = Serial Peripheral Interface, 4-wire bus )

08 August 2022

Soil Moisture Meter - update

I recently discovered a supplier of 3D printed enclosures for TTGO LoRa32v2 microcontroller development boards, and bought a couple. I have used a red one to give a completely new appearance to the LoRa link indoor receiver module. These enclosures are also available in black and dark blue.
The slot (top) is for a supplied fixing clamp ( not shown )

Having also upgraded the firmware, I am now uploading moisture data both to the Ubidots cloud and, simultaneously, to Thingspeak (see a previous post) without the Node-RED server.
From my Ubidots dashboard I can remotely turn on/off a green LED ( see image above ).  This feature could be used instead to control a solenoid valve for an automatic watering system.
Part of my Ubidots dashboard for the 'Soil Moisture Meter'


19 September 2021

Soil Moisture Meter - real time data

I am posting here moisture readings in real-time using two of the widgets in my ThingSpeak channel; see 24 July. If the sensor, LoRa link and WiFi are all operational, an update is made automatically every hour when a moisture measurement is taken in the herb garden. Other changes I have implemented are two additional widgets in ThingSpeak to display LoRa link received signal level, and receiver module chip temperature. Also I have removed the previous dependency on Node-Red by modifying the firmware so that the receiver module sends measurement data directly to ThingSpeak. ThingSpeak Embedded Plot

24 July 2021

Sending soil moisture data to ThingSpeak

My post on 8 June mentioned how I am using Ubidots with the Soil Moisture Meter to save and display measurement data on the cloud.
ThingSpeak™ is another such platform and, like Ubidots, there is a function node available for it in Node-RED which I added to an existing flow, making sending data to ThingSpeak very easy. 
I created a ThingSpeak channel called 'Soil Moisture', to receive and display the data. I have opened the channel to the public. So anyone can view the data by visiting ThingSpeak , then 'Channels' from the navigation bar, search for User ID 'SpacerLabs', and open channel 'Soil Moisture'. I invite anyone to 'export recent data' or 'add a comment' ; a ThingSpeak account is required for the latter.

My ThingSpeak channel 'Soil Moisture' displaying moisture data
Each channel can have up to 8 fields in use to hold any kind of data related to the particular application. I am using only 'Field 1' and 'Field 2' at the moment to hold the moisture measurement numerical value, and packet number respectively.
There will be a break in the hourly updated data if I don't have Node-RED activated; also the situation when using Ubidots.
More 'SpacerLabs' channels and sensors could be added in future. 

06 July 2021

New development board for the soil moisture meter

I have been using TTGO LoRa32 V1 development boards for my soil moisture meter project based on a LoRa wireless data link, and posted images of them on 15 February and 16 March. I discovered that V2.1 boards are available. So I bought one for about $23 to compare.
TTGO LoRa board v2.1 - note the 16GB SD card
The LoRa chip is unchanged; still the same SX127x family ( newer chips do exist ), but now in a metal can. The screening could give it improved rejection of interference which can cause false data packets to be generated. I have solved this problem anyway in software by including a destination address in the packet header.
The antenna connects directly with a SMA connector on the board, so not requiring the use of the coax cable pigtail of V1 with its inherent signal attenuation. I am noticing at least a 10dB ( x10 ) improvement in received signal level with V2.1 when I use both V1 and V2.1 boards side by side. 
V2.1 has a micro SD card slot. While not very useful for my moisture meter which is connected to on-line services for data storage, it was fun to try out and does mean that I could save all soil moisture measurements even if I am not running my Node-RED server. I bought a 16GB card ( the smallest I could find ) which is enough capacity for the next 112 thousand years of soil moisture measurements !
Measurement & time-stamp saved every hour to file moisture.txt on SD card
The image above highlights two interesting features of the soil moisture meter. At the time it had been in continuous operation for 719 hours, and at night.
     

08 June 2021

Deploying the Remote Soil Moisture Meter

Since the posts on 15 February, 16 and 27 March I have completed the LoRa wireless based remote soil moisture meter and deployed it for use in a herb garden outdoors. To conclude and summarise this project, I have brought some of the previously posted information together with its new features in this post.
The remote module with the moisture sensor pushed into the soil transmits the moisture measurement every hour using a LoRa wireless data link. It is battery and solar powered. The moisture meter will not be required all year round. So the solar panel only has to keep the battery sufficiently charged for a few hours of operation each day during the summer. The solar panel is supported by a tablet stand fixed down with 'P' clips.
Remote module & solar panel deployed outdoors - notice the antenna
The LoRa link receiver module, located indoors, receives the measurement value and displays it on its OLED display. 
Remote module with antenna & sensor - inset top right the receiver module
If the receiver module is connected to a wifi LAN it can also send the measurement value to a web-page,  my dedicated Android app, and additionally publish the RSSI ( received signal strength indication ) and time on an MQTT broker* ( making the data accessible world-wide ! ). If I have my Node-RED local server up and running, the measurement value can also be sent by email, saved to a file, published on the HiveMQ MQTT broker*,
The various message types that are published on the MQTT broker*

and saved to the cloud database of the Ubidots data visualisation platform for presentation.
My custom dashboard for presentation of the moisture data on Ubidots
See the previous posts and some recent Tweets going back to 23rd March for details of MQTT, Node-RED, LoRa, the webpage server & Android app.
* Subscribe to the topics SpacerLabs/Status, SpacerLabs/Moisture & SpacerLabs/Moisture1
     

01 April 2021

Using Node-RED with the UV Radiation Meter

Continuing with the theme of Node-RED ( and MQTT ) from the last post ( 27.03.2021 ), I have also created a 'flow' for use with the UV Radiation Meter ( see 12.01.2021 ).
My Node-RED 'flow' for passing UV radiation data to the HiveMQ broker
The 'flow' ( see image above ) starts by periodically reading the UV Index which was measured by the meter, assigns the appropriate W.H.O. level, joins the data as a single message and publishes it to the topic "SpacerLabs/Uvindex" on the HiveMQ MQTT broker. But only if the index has changed.

My messages published to the topic SpacerLabs/Uvindex
Not surprisingly the status of the radiation meter was 'ONLINE' at the time the UV radiation measurements were being made in my backyard. When subscribing to a topic(s) the last message the broker has received from the publishing client, flagged as 'Retained', is displayed to confirm the connection straightaway, without the delay until the next message arrives. Quality of Service, QoS, ( 0, 1 or 2 with 2 being the highest ), is an important part of MQTT. QoS defines a level of guarantee of delivery of messages between broker and client. I selected QoS = 1.  

27 March 2021

Using Node-RED with the Soil Moisture Meter

Node-RED is a programming tool for event-driven applications. 'Flows' to connect inputs to outputs, hardware and online services via 'nodes' are created in a browser based editor in a similar way to 'MIT App Inventor' which I use for my Android apps. I thought of an application for Node-RED with my Soil Moisture Meter ( post 16.03.2021 ).
The events I wanted to handle were to trigger an email to be sent when the soil moisture level was low, save the moisture measurements to a text file and also publish them to an MQTT* broker. The image below shows how I 'wired' nodes together in Node-RED to achieve that.
My Node-RED flow - from input (blue) to outputs (mauve & light green)
Starting at the top left of the flow, every hour the most recent data packet containing the moisture value is read from the webpage ( /Moisturevalue ) hosted by the moisture meter receiver. Only if the text 'dry' or 'partched' is found in the packet string is an email sent. I have preset the body of the email to read "The SpacerLabs Soil Moisture Meter ( Sensor 1 ) has notified a 'low moisture level' alert".
My moisture meter data published on the HiveMQ broker
All packets ( unfiltered ) are published under the topic 'SpacerLabs/Moisture1' to an online MQTT broker. I chose the free public broker 'HiveMQ'. My topic is 'open'; so anyone can connect to www/hivemq.com/demos/websocket-client and subscribe to the above topic to read my hourly data packets under the messages tab. But only when my Node-RED server and the moisture meter are running. I also publish the status, ( ONLINE, OFFLINE or DISCONNECTED ), of the moisture meter to the separate topic 'SpacerLabs/Status'.
More information on Node-RED can be found at nodered.org.
* MQTT Message Queuing Telemetry Transport https://mqtt.org      

16 March 2021

Remote Soil Moisture Meter

My current project is a remote soil moisture meter which uses LoRa wireless data technology. A soil moisture sensor will be in soil where plants are growing and be connected to a LoRa transmitter which sends the moisture measurement of the soil every hour to the LoRa receiver for display. I am thinking of using it in my herb garden. The receiver will be situated indoors.
Soil moisture sensor will be pushed into the soil
The LoRa receiver display
I have also connected a type LM35 analogue temperature sensor to the LoRa transmitter. The air temperature will also be measured and sent every hour. The complete packet of data that is sent contains the temperature, moisture value and level, and the packet number. I really only included the temperature to make the data-packet longer and more interesting.
The receiver hosts a web-page
I have completed the firmware, and added wi-fi functionality to the receiver so that the date/time stamp, web server and an Android app can be used. Everything works just fine when connected together in the lab.
Custom app "SpacerLabs_Moisture"

I shall probably post an update when I have completed the project by fitting the LoRa modules in suitable boxes, ( I'd find a 3D printer useful ! ), and purchasing a small solar panel for the transmitter. After that I might add more sensors in different locations which will require using the addressing protocol of LoRa, and also try to connect to my nearest LoRa gateway 6 kms away for LoRa-WAN.

For a short description of LoRa and my set-up see 15 Feb 2021.


15 February 2021

LoRa

I've started experimenting with another wireless data technology known as LoRa. LoRa ( Long Range ) is suitable for small amounts of data over distances up to several kilometres, and uses license free frequency bands in the UHF spectrum.
Regarding the hardware, my favourite development modules nowadays are based on the ESP32 microcontroller, ( see 02.8.20 ), and my searches discovered such modules with not only the built-in WiFi and Bluetooth capability of the ESP32, but also having LoRa transceiver chips as well ! I bought two, ( identical and with built-in OLED displays ), including antennas; one to be the transmitter, the other the receiver. Cost was just $23.
ESP32 based LoRa modules (R) transmitter (L) receiver

I uploaded some basic firmware I had written to program the modules for a simple test. I set up a very short 15cm link ( see image above, click to zoom ). The transmitter sends a data packet every few seconds comprising a text string "LoRa_868MHz" plus the packet number. The receiver displays the text in the received packet, the number of data bytes received and the received signal strength, RSSI, currently -45dBm.
Having got a LoRa link up and running the next step will be to connect a sensor to a remote transmitter, e.g., a soil moisture sensor outside in the garden, and send the sensor measurement to a receiver in the house. The herb patch in the far corner of my property would be a good choice of location. Because of the distance neither Bluetooth nor WiFi would be suitable technologies, and I'm guessing there's no WiFi coverage there anyway. 
A global LoRa network exists called LoRa-WAN, having an ever-increasing number of gateways giving access to it. My nearest gateway, 6.5Kms away, might receive my LoRa signal. Or I could setup my own gateway. Gateways are connected to Servers. So I could then log in to a server and see my sensor data when away from home. More information can be found at https://www.thethingsnetwork.org.


05 February 2021

My first Android app

I've created my first Android app. It's called "SpacerLabs UV" and is for use with the WiFi version of my UV Radiation Meter, ( see post 12.01.2021 ). The UV Index can be read from the meter's web-server, without the complete web-page, and there is also no need to open a browser first. All this has been achieved using a cloud-based tool for developing applications for Android devices, called "MIT App Inventor", ( appinventor.mit.edu ), and without any programming knowledge needed !
Basically, developing an app is a two part process using the Designer view and then the Blocks view. First, design the display by positioning components, ( e.g., buttons, labels, text boxes etc ) onto a viewer that looks like a phone. Then, using the Blocks view, connect functional blocks to assign functions to the components e.g., what should happen when a button is tapped. If the "MIT AI2 Companion" app has been installed on a smart phone, the effect of changes can be seen on an actual phone in near real-time via WiFi. When the app is finished, it is saved as a .apk file which can be emailed to a recipient as an attachment from where it can be downloaded and installed on an Android device.
Tapping 'Get UV Index' updates the value
My choice of icon for the app
The lower image shows the icon I chose to launch the app. The top image shows the app opened on a smart phone. It looks quite primitive, having only a few components and no menu bar. But it serves its purpose well. The UV Index 6.54 was measured one sunny morning this month on my balcony.


12 January 2021

Another wireless UV Radiation Meter

In the last post, ( 30 September 2020 ), I described my UV radiation meter. That version had Bluetooth (BLE) enabled. Since then I have made a second * version of the meter, but this time having WiFi functionality instead. It is based on the same hardware ( SI1145 sensor & Heltec WiFi Kit 32 module ) as before. As the WiFi Kit 32 module ( see 02 August 2020 ) has both integrated Bluetooth and WiFi, the only changes needed have been to the firmware. I have used an identical enclosure; so the physical appearance is also the same. However, different information is now being displayed on the OLED display.
In use, WiFi typically has a communication range greater than BLE. The meter can be configured either as a Client station connected to an existing network's WiFi router, or as a stand-alone WiFi Access Point; the latter being the more suitable for outdoor use. The meter hosts a web-server, so that a web-page with the UV index measurement can be displayed by connecting to its IP address using a browser on a pc, smart phone, or other WiFi enabled devices etc.
 
A simulated reading displayed on a smart phone

The image above shows the UV Index measurement displayed in a browser. I should point out that the reading was made under controlled laboratory conditions during testing. A background UV Index reading made in an indoor environment would typically be about 0.02 !  

I am calling it the "Spacer-Labs" UV radiation sensor after the location of my laboratory.

* Actually I have also made a third version without any wireless connectivity at all.      

30 September 2020

UV Radiation Meter

Frequent or prolonged exposure to high levels of solar ultra-violet (UV) radiation can damage the skin. But how can we know exactly what that level is ?
I've designed a UV Radiation Meter to measure and display ultra-violet light radiation from the sun. It will be useful to quantify what UV radiation level I am actually exposed to when outside, particularly in summer, though I do normally take the precaution of at least wearing reactive spectacles and a hat.
The meter is based on the Silicon Labs SI1145 UV Index sensor, ( with I2C interface - see 27 March 2019 ), and the Heltec WiFi Kit 32 (HTIT-WB32) ESP32 development board with blue OLED display which I featured in the last post. It has an internal 3.7V 1000mAh Lithium battery which gives about 17.5 hours of continuous operation, and can be recharged in-situ by USB; charging time 3 hours 40 mins. I chose a stylish white hand-held enclosure; it looks quite smart.
UV Index, ( zero to 11+ ), and UV Level are displayed according to the W.H.O. definitions; Low, Moderate, High, Very High & Extreme.
UV meter displaying an indoor measurement
In the image above, access to the micro usb connector for battery charging and programming is on the left.
I completed it too late for using it much this year; but it's ready and waiting for next summer.
( W.H.O = World Health Organisation )

02 August 2020

Wi-Fi and Bluetooth with ESP8266 & ESP32

Several years ago I began experimenting with Wi-Fi using modules based upon the ESP8266 family of devices manufactured by Espressif Systems in Shanghai. They are microcontroller chips with built-in 2.4GHz Wi-Fi capability. Development boards using these chips are readily available at very low cost from many different suppliers. At first I used the basic ESP8266-01 incorporating the ESP8266EX chip, and then progressed to boards with more functionality ( I/O, serial comms, ADC etc ) i.e., the NodeMCU-12E using the ESP8266MOD. I was thinking about some IoT ( Internet of Things ) applications. Although I made some gadgets, nothing was actually being controlled remotely. Eventually I moved on to other activities.
However, my interest in this topic returned recently after discovering the successor to the ESP8266, namely the ESP32, ( 32bit, 240MHz clock & more memory ), with both built-in Wi-Fi and Bluetooth ( classic Bluetooth & Bluetooth Low Energy, BLE, server & client ) capability; also development boards incorporating the ESP32 such as the NodeMCU-32S and some others including a video camera ( ESP32-CAM ) or an OLED display ( Heltec WiFi Kit 32 ). All these remarkable devices cost only a few dollars.
My collection of Wi-Fi & Bluetooth development modules
In the above image, left to right :-
NodeMCU-12E, Wi-Fi only.
NodeMCU-32S, Wi-Fi and Bluetooth.
WiFi Kit 32, Wi-Fi and Bluetooth, 128 x 64 px OLED display.
ESP32-CAM, Wi-Fi and Bluetooth, 2Mpx video camera, 4GB uSD card slot.
ESP8266-01, Wi-Fi only.

Perhaps I'll make a BLE server to notify a value from an unusual sensor; e.g., air quality, charged particles, UV, magnetic field. ( Obviously for my personal experimental use in my private capacity as a hobbyist. )

( I tweeted updates to this post on 5 August 2020 and 12 August 2020. Click on the link on the left ).

05 July 2020

SpaceLabs MicroTrackers

On 6 October and 24 November 2019 I briefly described a future project using a GNSS receiver module with a microcontroller and a display, to parse GPS NMEA text strings and display my choice of data in an easy-to-read form.
I have now completed 3 versions using different firmware, GNSS receivers, microcontroller development boards, and displays. I call them "SpaceLabs MicroTrackers".
Depending on the version, date, time, latitude, longitude, altitude, nr. satellites acquired, fix quality, and update age are displayed. Features they all have in common are a 25x25mm active ceramic patch antenna, USB interface for programming/power and Ublox Neo-6M compatible GNSS receiver module.
While waiting for enough satellites to be acquired for a position fix, version details, local temperature and battery voltage are displayed. I also designed some graphics using bitmap byte arrays and scrolling animation.

MicroTracker-3 with Arduino board, 128x64px Oled display
MicroTracker-2 with PIC board, 128x32px Oled display
MicroTracker-4 with Arduino board, 84x48px Nokia 5110 display

On MicroTracker-4 I have provided a 1 pulse per second ( 1pps ) signal on an external connector. This is an extremely accurate 1Hz pulse ( 10% duty cycle ) locked to the satellites' atomic clock. When locked-on, a LED on the GNSS receiver module flashes on/off once a second.
Waveform of 1pps signal from MicroTracker-4

A second usb socket on MicroTracker-4 gives access to the GNSS receiver module for changing its settings and displaying complete NMEA sentences on a serial terminal.
 
My recent experience gained with OLED and Nokia 5110 displays has been put to practical use.

10 June 2020

Nokia 5110 Liquid Crystal Display

I recently discovered surplus Nokia 5110 Liquid Crystal Displays ( LCD ) which were used in Nokia 5110 phones, circa 1998. Thousands of these interesting display modules are available at on-line auction sites. I bought four, about GBP2.30 each; two having a blue back-light and two with white. The resolution is 84 x 48 pixels; overall dimensions 4.5 x 4.5cms. The controller/driver chip is PCD8544. I searched for and downloaded the data sheet; essential reading !
Nokia 5110 LCD types: back-light colour (L) blue (R) white
Communicating with the display uses the SPI ( Serial Peripheral Interface ) bus specification, which is a synchronous MASTER/SLAVE configuration with the MASTER generating the clock. As well as supply and ground, the following 5 connections to the display are needed; Chip Enable ( CE ), Serial Clock ( CLK ), & Serial Data ( DIN ), and additionally, for control purposes, Data/Command ( DC ), and Reset ( RST ). Back-light ( BL ) connection is optional.
6 config bytes being sent to display on SPI: top CE, mid CLK, bottom DIN
Basically, using the display requires (i) configuring display settings, and (ii) knowing how the addressing of the DDRAM works when writing data for displaying. To try out the display I connected it to the PIC microcontroller ( MSSP module ) on my prototyping board, and ran some code to measure and display temperature and voltage. The bus speed I chose was 1MBit/s.
The display lacks a built-in font. But that was quickly remedied by finding a ASCII character set 5x7pixel font file online, and including it as a header file in my C-code.
Nokia 5110 LCD with white back-light in use
I was disappointed with the blue back-lit display being hard to read, despite spending a lot of time experimenting with contrast, bias and temperature coefficient settings. The white back-light variant is much better in this respect.
I found the display very easy to use; now ready for a suitable future project.
( Click on images to zoom ).
MSSP = Master Synchronous Serial Port, DDRAM = Display Data RAM

20 January 2020

Upgrading my design tools for PIC projects

2020 has just begun, and here is my new year's  resolution, which I have already completed !
For my embedded control projects it was time to standardise on PIC microcontrollers, ( e.g., the PIC16F188** family ), belonging to a newer generation than some of those I had previously been using. PIC development in recent years has now led to devices typically having larger memory, supporting higher clock speeds, with more peripherals including core independent peripherals, and new features, such as peripheral pin select, device information area, configurable logic cell, integrated temperature sensors to name a few.

The new development platform for my embedded control projects
As result I have had to upgrade my hardware tools as well for compatibility; the most significant change being the MicroChip "Snap" programmer/debugger, to replace my obsolete ICD2, and a different prototyping board, which I could call MyDev3, ( see post dated 2 November 2010 ). The MCU featured in the image is a 40 pin 8-bit device, MicroChip PIC part PIC16F18875/P. ( Click on image to zoom ).
All is working fine. The PIC was a new unused blank device and successfully programed with my TEMPSENS-OLED firmware. ( See post dated 6 October 2019 ).
MCU = MicroController Unit, PIC = Programmable Integrated Circuit from MicroChip Inc.


24 November 2019

Positioning Satellite Receiver module & NMEA Sentences

In my last post I mentioned a future project using a positioning satellite receiver module, ( GNSS receiver ).  Since then I've been trying out the MakerHawk GPS 51, incorporating the Goouuu Tech GT-U7 module*. It cost just GBP8.99 and includes an external antenna.
MakerHawk GPS 51 receiver with active antenna
For convenience ( least effort ) rather than a good view of the sky, ( which there certainly wasn't ), I positioned it close to my laptop ( in fact on top of the printer ) in the centre of a room far from two small windows, connected it to the laptop via a usb to uart serial converter, and opened a serial terminal program.
(L) Uart (R) MakerHawk GPS 51 in operation
I doubted if there would be enough satellites received in that position; but after just a few seconds "NMEA Sentences" were being streamed every second and a position fix given. I was absolutely amazed  !!
NMEA Sentences ( click on image to zoom in )
These text strings of comma separated values are known as "NMEA Sentences"; NMEA standing for National Marine Electronics Association. There is plenty of information online to explain the complete format in detail. For my project, I am particularly interested in the sentence starting $GPGGA. GP means it is the US GPS system, ( if GL here it would mean the Russian GLONASS system, GB Chinese BEIDOU, and there are others ), and GGA signifies that it is a position, time and fix data sentence. On examining this sentence I can quickly find the time, my latitude (N), and longtitude (E). The sentence also states, ( among other things ), that my altitude was 87.5m and that a total of 10 satellites had been acquired in order to give the position fix; not bad from the middle of the room.
Now I am going to write some software for my microcontroller to parse the $GPGGA sentence and display latitude, longtitude, altitude, and time, in a more user-friendly form on an OLED display.
* Advertised and sold online as being compatible with the UBlox Neo-6M receiver module. If so, then I assume that UBlox software ( eg u-centre ) and data-sheet for the Neo-6M at www.u-blox.com can be used with the Goouuu Tech GT-U7.
GNSS = Global Navigation Satellite System